Control Center
An operations dashboard combining unattended runs, pending decisions, sample spend, and deployment records. This prototype example shows how an operator can find work that needs attention without implying verified deployment.
- Contribution
- I built the aggregator, adapters, run wrapper, configuration, and visual composition, with Homepage and Healthchecks credited for their contributions.
- Maturity
- Prototype
Interactive simulation · sample data
Primary demonstration
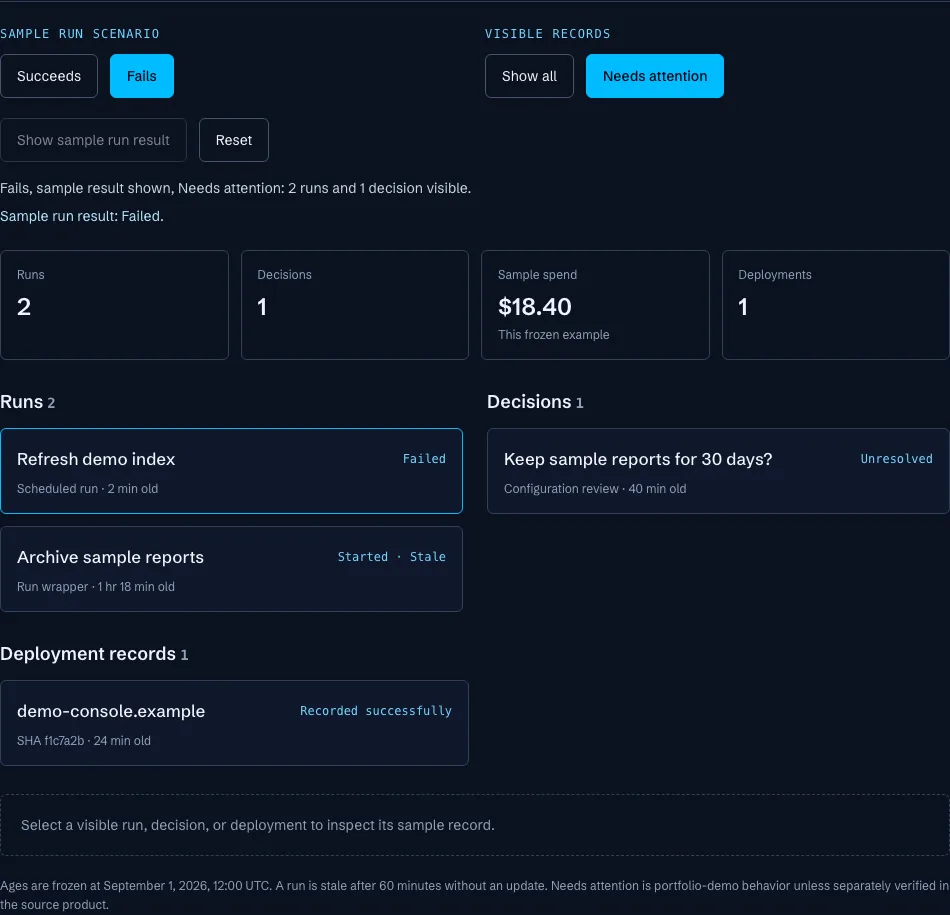
Portfolio simulation screenshot: the Fails scenario and Needs attention filter show two runs and one unresolved decision, with fictional spend and deployment records. Control Center is a Prototype; deployment is unverified. Ages use a frozen sample time. Homepage and Healthchecks retain credit.
Dashboard example · sample data
Operator attention view
A deterministic prototype for inspecting runs, decisions, sample spend, and a fictional deployment record.
Implemented dashboard; deployment not verified.
Public example checked 2026-09-12. Portfolio simulation screenshot: the Fails scenario and Needs attention filter show two runs and one unresolved decision, with fictional spend and deployment records. Control Center is a Prototype; deployment is unverified. Ages use a frozen sample time. Homepage and Healthchecks retain credit.
Media: text-based sample fixture. Role: operator attention dashboard. Maturity: Prototype.
Limits: the browser does not query services, start runs, make decisions, deploy software, use storage, or open a live connection.
Succeeds · Started · Show all
Initial server reference
Frozen 2026-09-01 12:00 UTC
Runs
1
Decisions
1
Sample spend
$18.40
Deployments
1
Refresh demo index
Scheduled run · Started · 8 min old
Keep sample reports for 30 days?
Configuration review · Resolved · 40 min old
This frame stays available if the controls cannot load. The complete success, failure, attention-filter, detail, deployment, and Reset walkthrough remains below it.
Interactive controls load when this example comes into view.
If the interactive example stops responding, Reload this example.
Problem and workflow
The problem
Unattended operations scatter useful signals across run histories, decision queues, cost summaries, and deployment records. An operator needs a compact way to see what changed, notice what needs attention, and inspect the record behind a count. A dashboard can easily overstate confidence, though: a fixture can look live, a static age can look current, and a deployment row can be mistaken for proof that the dashboard itself was deployed. This prototype makes those boundaries explicit while demonstrating the information hierarchy with deterministic sample data.
The workflow
The server frame starts with Succeeds, Started, and Show all. Scenario controls choose one of two fixed datasets, while Show sample run result moves only the primary run to its authored terminal state. Show all and Needs attention derive both lists and counts from the same selected dataset. Runs, decisions, and the deployment row open read-only details. Ages are calculated against September 1, 2026 at 12:00 UTC, and a run is stale after 60 minutes without an update. Reset restores the initial state. The portfolio interaction never queries an operations service or changes a record.
01Inspect a successful sample run
- 01The initial server reference shows Succeeds and Started with one recent run, one resolved decision, the fixed sample-spend value, and one fictional deployment record.
- 02Choose Needs attention. Both visible counts become zero and each empty group says that no items need attention in this example. Spend and deployment totals stay unchanged.
- 03Return to Show all and select the resolved decision. Its descriptive source type, frozen age, resolution status, and short explanation open in a read-only detail panel.
- 04Select Show sample run result. The primary run moves from Started to Succeeded. No process runs, and the purpose-written source fixture remains unchanged.
02Find the failed and stale sample records
- 01Choose Fails. The primary run returns to Started. With Show all active it becomes the selected detail, while the dataset also contains one explicitly stale started run and one unresolved decision.
- 02Choose Needs attention. The recent primary run is hidden, so its detail clears. The stale run and unresolved decision remain, producing counts of one run and one decision.
- 03Select the unresolved decision to inspect its descriptive source and frozen age. There is no approve or reject control because this portfolio example is read-only.
- 04Select Show sample run result. The primary run becomes Failed and joins the stale run, so attention counts become two runs and one decision. The failure is an authored example, not a live operational result.
- 05Select the deployment row from either filter to see its fictional target, abbreviated SHA, recorded result, and sample explanation. This record is not evidence that Control Center is deployed.
- 06Select Reset. The dashboard returns to Succeeds, Started, Show all, and no open detail, without storage or URL state.
Engineering and evidence
Decision 01
Filtering must not make headline counts disagree with the lists below them.
- Choice
- Derive visible run and decision records first, then calculate both counts from those same arrays.
- Consequence
- Show all and Needs attention stay internally consistent while sample spend and deployments remain independent of the filter.
Decision 02
Relative ages can imply a live feed when they continue changing.
- Choice
- Store ISO timestamps in the fixture and calculate display ages against one visible frozen timestamp and a 60-minute stale rule.
- Consequence
- Every walkthrough is repeatable, stale state is testable, and the page does not need a timer or background refresh.
Decision 03
The prototype must explain operational inspection without becoming an operations client.
- Choice
- Project one strict sample fixture into a Control Center-specific reducer with named scenario, filter, selection, result, and Reset events.
- Consequence
- The browser cannot start runs, make decisions, deploy software, fetch private services, or turn a fictional deployment row into an availability claim.
Contribution and credits
I built the aggregator, adapters, run wrapper, configuration, and visual composition, with Homepage and Healthchecks credited for their contributions.
- My contribution is the aggregator, adapters, run wrapper, configuration, and visual composition used to bring the prototype view together.
- Homepage and Healthchecks are credited as upstream projects whose ideas and capabilities informed parts of the dashboard.
Current limits
- Implemented dashboard; deployment not verified. The maturity label Prototype describes this showcase accurately.
- Every run, decision, host, job name, timestamp, spend value, deployment target, SHA, and result is purpose-written sample data. None is a measured business outcome or production record.
- Needs attention is portfolio-demo behavior unless separately verified in the source product. The fixed service-down placeholder from the inspected source is omitted.
- The browser uses no timer, storage, API, WebSocket, EventSource, provider, messaging, deployment, repository, or process operation.
About this example
Purpose-written Control Center portfolio simulation checked September 12, 2026. The overview image shows the local sample dashboard, not an operational capture. The dashboard is frozen at September 1, 2026 at 12:00 UTC and marks a run stale after 60 minutes without an update. All records are fictional. Control Center remains a Prototype with deployment unverified; Homepage and Healthchecks retain their upstream attribution.
Checked September 12, 2026
Evidence details
Portfolio simulation screenshot: the Fails scenario and Needs attention filter show two runs and one unresolved decision, with fictional spend and deployment records. Control Center is a Prototype; deployment is unverified. Ages use a frozen sample time. Homepage and Healthchecks retain credit.
illustrative